What Japanese Candlesticks Talk About?
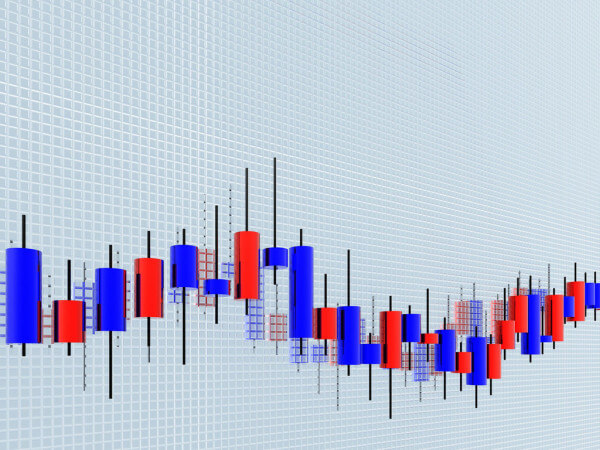
Price movement can be displayed on various charts. In technical analysis, Japanese candlesticks are the most popular and informative charts. Japanese candlesticks allow the trader and investor to obtain key information on price
movements, such as the opening and closing prices, high and low prices during the trading period.
Japanese candlesticks can be represented in almost any time frame. For example, if we form an hourly chart of Japanese candlesticks, this means that one candlestick is formed according to the price movement that took place within an
hour. The price at the beginning of the hour is the opening price and the price at the end of the hour is the closing price. The high and low prices represent the high and low values of the candlestick shadows.
So, first you need to understand the structure of the Japanese candlestick. Figure 1 shows the structure of the Japanese candlestick.
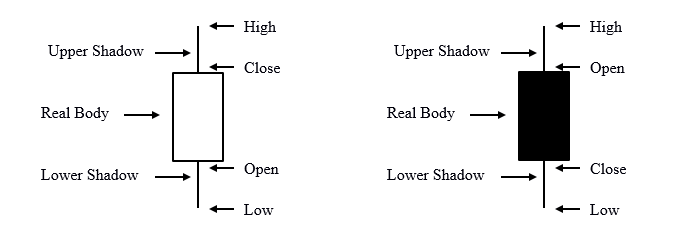
Figure 1 - Japanese Candlesticks: structure
The body of a candlestick is the distance between the opening price and the closing price. The shadow of a candlestick is the distance between the open / close price and the high / low price. The color of the candlestick can be used to
determine whether the price has decreased or increased during the current period. As a rule, the candlesticks during the period of which the price fell are painted with a dark fill. The candlesticks during the period of which the price
has increased are formed transparent. These colors can be substituted for red and green.
How to interpret Japanese candlesticks? Figure 2 shows bullish candlesticks.
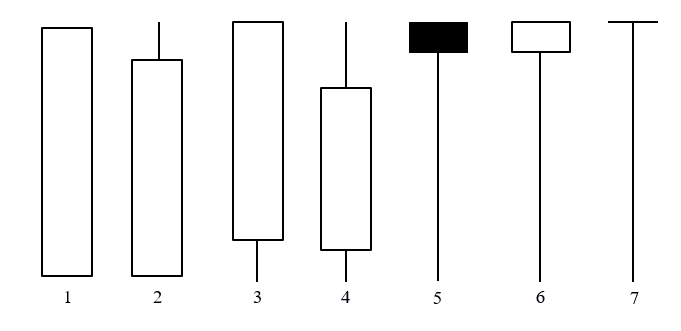
Figure 2 – Bullish Candlesticks
Candles 1, 2, 3 have large bodies, such candles are called Marubozu, shadows can be short or absent. Candles 5, 6, 7 are called Paper Umbrella and have a long shadow. Such candles indicate the predominance of buyers in the market,
which move prices up. Depending on where they appear, these candles form reversal patterns.
Candles that do not have a body or it is very small are called Doji, they are shown in Figure 3.
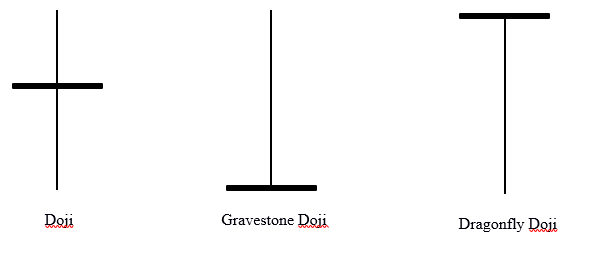
Figure 3 – Doji
The market movement is determined by the candlestick that follows the Doji. If it has a closing price higher than Doji, then bullish sentiment prevails in the market. If it has a closing price lower than Doji, then bearish sentiment
prevails in the market. If the Doji candlestick forms a reversal pattern, its significance is enhanced.
Figure 4 shows candlesticks that indicate a fall, i.e. bearish candlesticks.
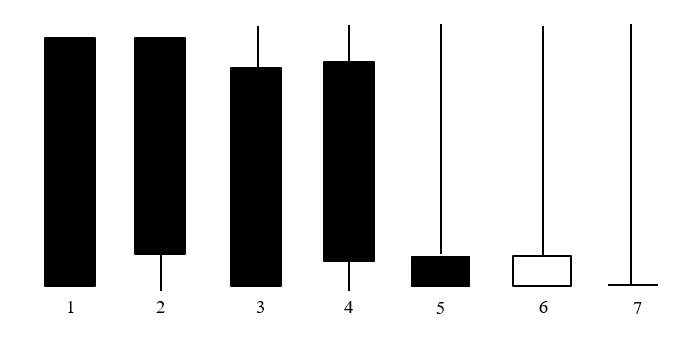
Figure 4 – Bearish Candlesticks
Candles 1, 2, 3 are similar to bullish candles - they are called Marubozu. Candle 4 has a medium-sized body and shadows on both sides. Candles 5, 6, 7 are called Inverted Umbrella, their color does not really matter. These candles
indicate that sellers dominate the market and push prices down.
The analysis of Japanese candlesticks, like any other method, has its own areas and boundaries of application, if followed, this method can provide the investor and trader with highly reliable signals of market trends or reversal of
market trends.